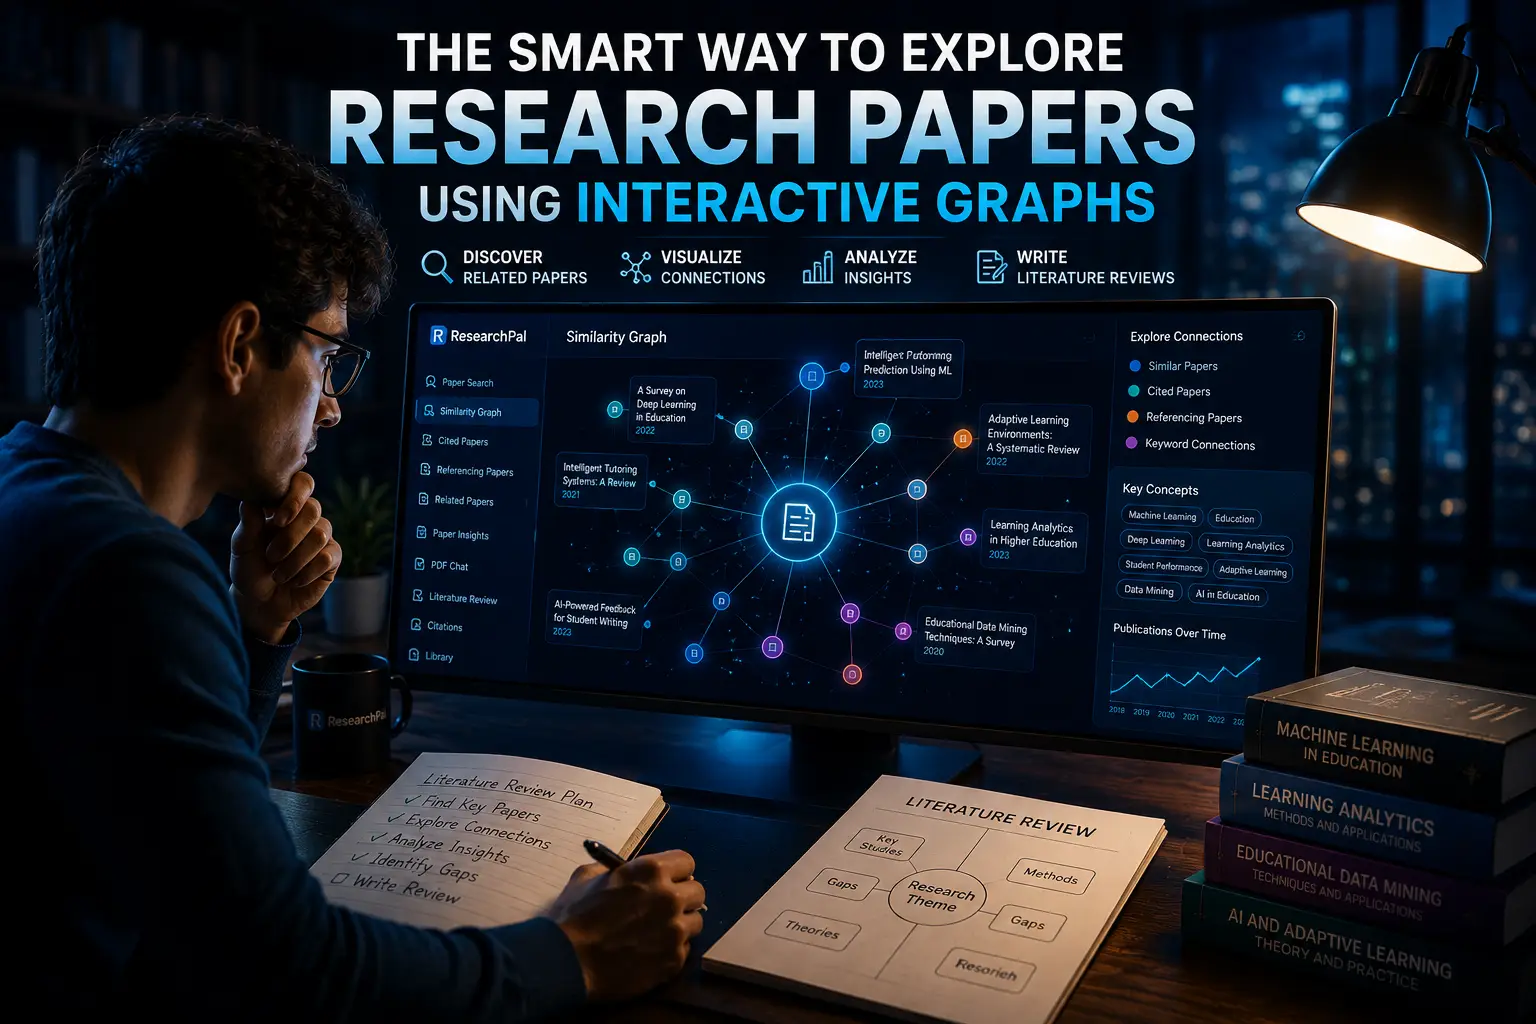
Finding academic papers has never been easier—but understanding how those papers connect is still one of the biggest challenges researchers face. Traditional keyword searches return long lists of articles, forcing researchers to manually compare abstracts, references, authors, and publication dates. This process becomes increasingly time-consuming as the literature grows. What if you could see the relationships between papers instead of searching for them one by one? Interactive research paper graphs make this possible. Rather than presenting isolated search results, they visualize how studies are connected through citations, semantic similarity, keywords, and research themes. Researchers can quickly identify influential papers, discover overlooked studies, follow emerging topics, and build stronger literature reviews. Modern AI-powered research platforms like ResearchPal take this even further by combining Similarity Graphs, academic paper search, citation exploration, PDF Chat, Paper Insights, literature review generation, and research library management into one connected workflow.
Research Discovery Summary
Researchers no longer need to rely only on keyword searches to discover academic literature. Interactive research paper graphs visualize citation relationships, semantic similarity, keyword connections, and author networks. ResearchPal’s Similarity Graph combines interactive graph exploration with academic paper search, PDF Chat, Paper Insights, literature review generation, citation management, and research library organization.
- Visualize citation relationships
- Find related papers faster
- Discover hidden research clusters
- Generate literature reviews
- Analyze PDFs with AI
Quick Answer
Interactive research paper graphs allow researchers to visualize how academic papers relate to one another through citations, keywords, semantic similarity, and shared references. They simplify literature discovery, reveal influential studies, uncover hidden connections, and reduce repetitive searching. ResearchPal’s Similarity Graph helps users move from one paper to an entire connected research network while supporting literature reviews, PDF analysis, citation management, and academic writing.
Why Traditional Paper Search Is No Longer Enough
Most researchers begin by entering a few keywords into Google Scholar or another academic search engine.
Although this approach works initially, it often creates several problems.
Endless Keyword Variations
Researchers constantly change search terms hoping to uncover additional papers.
For example:
- AI in education
- Artificial intelligence learning
- Intelligent tutoring systems
- Adaptive learning
- Machine-assisted education
Each search returns different results, making literature discovery inefficient.
Important Papers Stay Hidden
Many relevant papers use different terminology even though they discuss the same concept.
A keyword search may overlook:
- Alternative theoretical frameworks
- Related disciplines
- Similar methodologies
- Influential foundational studies
No Visual Context
Traditional search engines list papers individually.
They rarely show:
- Which papers influenced others
- Which authors collaborate
- Which topics form research clusters
- Which papers bridge different disciplines
Researchers must manually build these connections themselves.
What Are Interactive Research Paper Graphs?
Interactive research paper graphs are visual representations of academic literature.
Instead of displaying papers as isolated search results, they display them as connected nodes within a research network.
Each node represents a paper.
Lines between nodes represent relationships such as:
- Citations
- Shared references
- Semantic similarity
- Common keywords
- Author collaborations
- Research themes
Researchers can click any node to expand additional related papers, allowing literature discovery to become an exploratory process rather than repeated keyword searching.
How Citation Graphs Reveal Hidden Research Connections
Citation graphs show how one research paper references another.
This allows researchers to quickly identify:
- Foundational papers
- Highly influential studies
- Research trends
- Emerging topics
- Contradictory findings
- Research gaps
Instead of asking,
“What papers contain this keyword?”
Researchers begin asking,
“What papers influenced this study?”
This shift dramatically improves literature reviews.
Types of Interactive Research Graphs
Different graph visualizations reveal different aspects of academic literature.
Citation Graphs
Citation graphs connect papers that directly reference one another.
Best for:
- Following research history
- Identifying landmark papers
- Finding recent follow-up studies
Similarity Graphs
Similarity graphs connect papers discussing similar ideas, even when different terminology is used.
This is especially useful when researchers want conceptually related studies rather than exact keyword matches.
ResearchPal’s Similarity Graph uses this approach to help researchers discover connected literature beyond traditional keyword searching.
Keyword Graphs
Keyword graphs group research around recurring concepts.
These visualizations help researchers:
- Discover emerging themes
- Learn field-specific terminology
- Identify popular research directions
Author Networks
Author graphs visualize collaborations between researchers.
Researchers can quickly identify:
- Leading experts
- Research groups
- Frequent collaborators
- Institutions driving innovation
Co-Citation Networks
Two papers become connected when many later publications cite both together.
These networks reveal influential research communities and theoretical foundations.
Benefits of Interactive Research Graphs
Interactive graphs transform how literature reviews are conducted.
Discover Hidden Papers
Graph exploration often uncovers highly relevant studies that keyword searches miss.
Understand Research Evolution
Researchers can see how theories develop over time.
This helps identify:
- Original discoveries
- Major breakthroughs
- Current research directions
Find Research Clusters
Graphs reveal groups of closely related papers.
Researchers can immediately recognize major themes within a field.
Identify Influential Studies
Highly connected nodes often represent important publications.
These papers frequently serve as foundational references for literature reviews.
Save Time
Instead of performing dozens of searches, researchers explore one connected network.
This dramatically reduces repetitive searching.
How ResearchPal’s Similarity Graph Works
ResearchPal introduces an AI-powered approach to visual literature exploration.
Instead of only displaying search results, ResearchPal allows users to navigate connected academic papers through Similarity Graphs.
Researchers can explore:
- Related Papers
- Referenced Papers
- Referencing Papers
- Keyword Connections
- Citation Relationships
- Similar Research Topics
Every selected paper becomes the center of a growing research network.
Researchers can continue expanding the graph to discover additional literature without restarting their search.
Beyond Graphs: ResearchPal’s Complete Research Workflow
Unlike standalone visualization tools, ResearchPal integrates interactive graphs into a complete academic workflow.
Researchers can:
Search Academic Papers
Find scholarly articles using keyword and semantic search.
Generate Literature Reviews
Convert discovered papers into structured literature reviews.
Chat with PDFs
Ask questions directly about uploaded research papers.
Analyze Multiple Papers
Use Paper Insights to compare:
- Methodologies
- Findings
- Datasets
- Limitations
- Research gaps
Generate Citations
Automatically create citations in multiple academic styles.
Manage Research Libraries
Organize papers into projects while importing references from Zotero and Mendeley.
ResearchPal vs Traditional Academic Search
| Feature | Traditional Search | ResearchPal |
|---|---|---|
| Keyword Search | ✓ | ✓ |
| Semantic Search | Limited | ✓ |
| Similarity Graph | ✗ | ✓ |
| Citation Exploration | Partial | ✓ |
| Related Papers | Basic | ✓ |
| PDF Chat | ✗ | ✓ |
| Literature Review Generator | ✗ | ✓ |
| Paper Insights | ✗ | ✓ |
| Citation Generator | Limited | ✓ |
| Research Library | Limited | ✓ |
ResearchPal vs Other Research Graph Tools
| Feature | ResearchPal | Connected Papers | ResearchRabbit |
|---|---|---|---|
| Interactive Graphs | ✓ | ✓ | ✓ |
| Academic Search | ✓ | Limited | Limited |
| Literature Review Generator | ✓ | ✗ | ✗ |
| PDF Chat | ✓ | ✗ | ✗ |
| Paper Insights | ✓ | ✗ | ✗ |
| Citation Generator | ✓ | ✗ | ✗ |
| Research Library | ✓ | ✗ | Collections |
| Academic Writing Tools | ✓ | ✗ | ✗ |
ResearchRabbit and Connected Papers are excellent visualization tools, but ResearchPal extends graph-based discovery into a complete research environment where searching, reading, analyzing, citing, and writing happen within one platform.
Best Practices for Using Interactive Research Graphs
To get the most value from research graphs:
- Start with a high-quality seed paper.
- Explore both references and citing papers.
- Follow multiple branches instead of one path.
- Save important papers as you discover them.
- Compare methodologies before reading every paper.
- Use semantic search alongside graph exploration.
- Organize findings into literature review themes.
Common Mistakes Researchers Make
Depending Only on Keywords
Keyword searching alone often misses valuable interdisciplinary studies.
Ignoring Citation Relationships
Influential papers frequently emerge through citation networks rather than search rankings.
Saving Every Suggested Paper
Not every connected paper is relevant.
Always review abstracts and methodologies before including a study.
Treating Visualization as Analysis
Graphs reveal relationships, but researchers must still critically evaluate evidence.
Why Interactive Graphs Improve Literature Reviews
Interactive graphs help researchers move beyond isolated papers.
Instead of collecting disconnected articles, researchers build an interconnected understanding of the literature.
This makes it easier to:
- Identify research gaps
- Compare competing theories
- Discover overlooked evidence
- Understand research evolution
- Write stronger literature reviews
When combined with ResearchPal’s Literature Review Generator, Paper Insights, PDF Chat, and Research Library, interactive graphs become part of a complete AI-powered academic research workflow.
Final Thoughts
The future of academic research is no longer about finding individual papers—it is about understanding how those papers connect.
Interactive research paper graphs transform literature discovery by revealing citation networks, semantic relationships, author collaborations, and hidden research clusters.
ResearchPal brings these capabilities together with academic search, Similarity Graphs, literature review generation, PDF analysis, citation management, and AI-powered writing assistance, helping researchers spend less time searching and more time generating meaningful insights.
Key Takeaways
- Interactive research paper graphs visualize relationships between studies.
- Citation and similarity graphs uncover hidden literature faster than keyword searches.
- ResearchPal’s Similarity Graph helps researchers discover related papers through citation and semantic connections.
- Combining graph exploration with Paper Insights, PDF Chat, Literature Review Generation, and Research Library creates a complete AI-powered academic workflow.
- Interactive visualization enables researchers to understand research fields rather than simply search them.
From The Web
Interactive Research Paper Graph FAQs
Clear answers about citation graphs, similarity maps, related-paper discovery, and ResearchPal’s interactive research workflow.
An interactive research paper graph is a visual network that displays academic papers as connected nodes. The connections may represent citations, shared references, keywords, semantic similarity, or related research themes.
ResearchPal’s Similarity Graph helps researchers explore cited papers, referencing papers, and keyword-related studies without repeatedly starting new searches.
Citation graphs show how studies influence one another. They help researchers identify foundational papers, influential authors, later extensions, replications, criticisms, and emerging research directions.
ResearchPal connects citation exploration with academic paper search, PDF Chat, Paper Insights, citations, and literature review generation.
A similarity graph connects papers that discuss related ideas, use similar methods, share keywords, or belong to overlapping citation networks.
ResearchPal uses Similarity Graphs to help users discover conceptually related research that exact keyword searches may overlook.
Yes. Interactive graphs help researchers discover related papers, recognize research clusters, identify influential studies, trace topic development, and uncover gaps between areas of literature.
ResearchPal extends this process with its Literature Review Generator, Paper Insights, PDF Chat, Citation Generator, and Research Library.
ResearchPal combines academic paper search, referenced and citing paper exploration, Similarity Graphs, PDF Chat, Paper Insights, citation generation, literature review creation, and research library management.
This allows researchers to move directly from visual discovery to reading, analysis, citation management, and academic writing.
Explore ResearchPalResearch graphs and keyword searches solve different problems. Keyword and semantic searches help identify initial papers, while graphs reveal citation relationships, hidden clusters, and conceptually related studies.
The strongest workflow combines ResearchPal’s academic search with its interactive Similarity Graphs.

