Academic research can feel overwhelming when you first enter a new field. You search for a topic, receive hundreds or thousands of results, open several papers, follow their references, and quickly find yourself surrounded by more literature than you know how to organize.
A research paper graph offers a different way to explore academic literature.
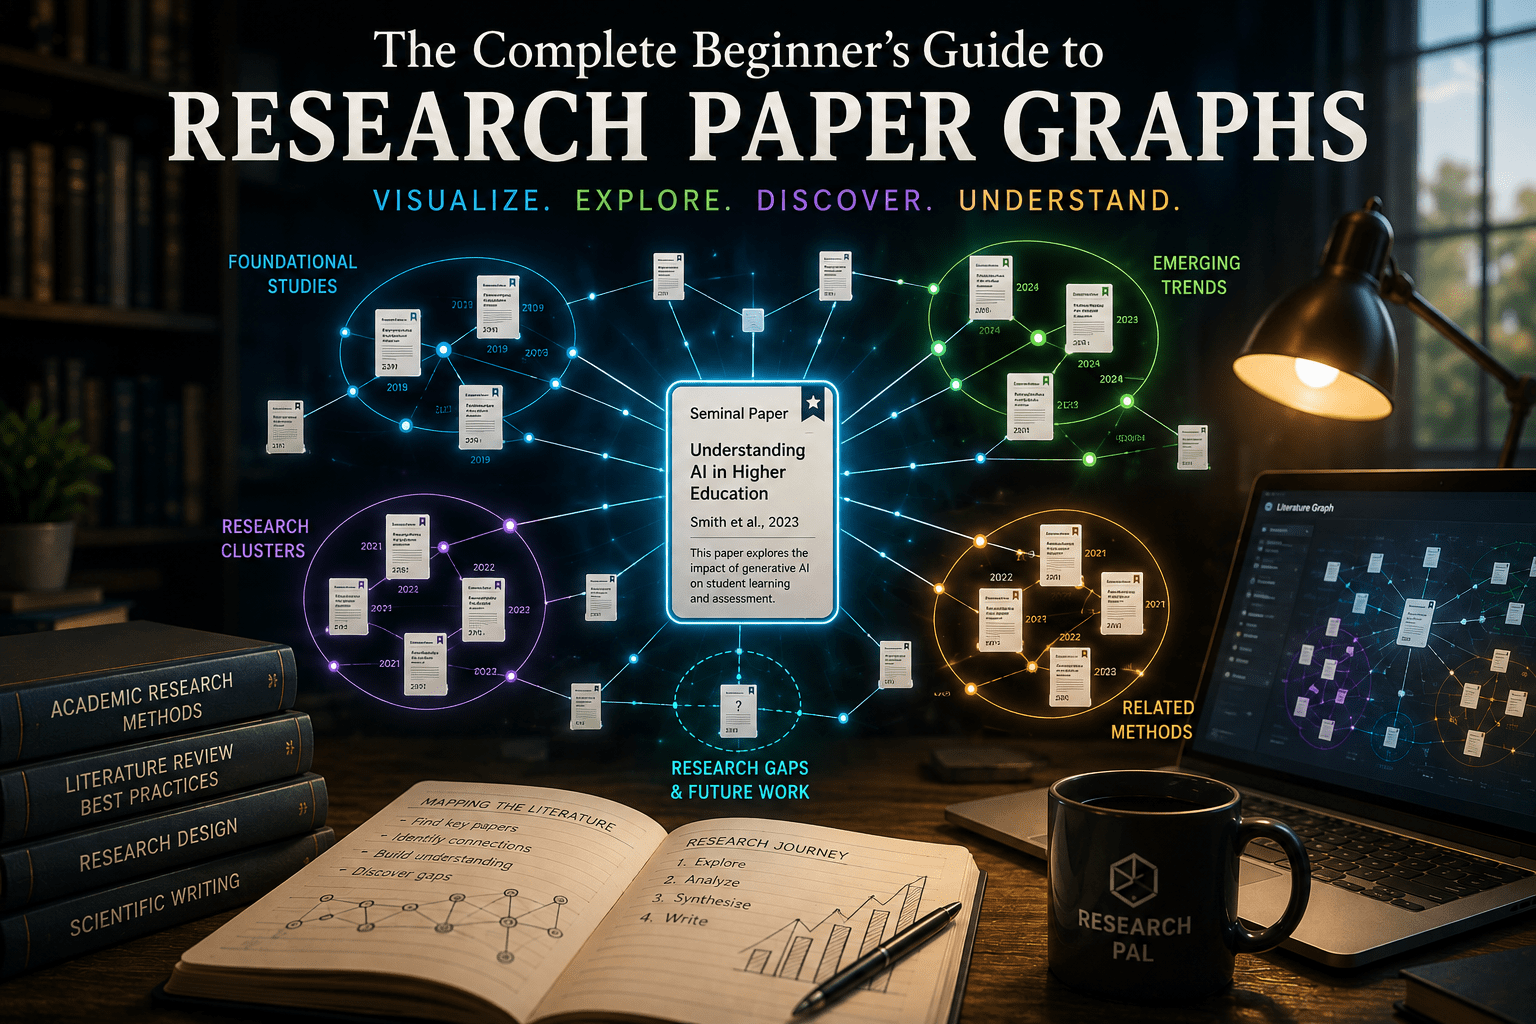
Instead of presenting research as a long list of search results, a research paper graph represents publications visually. Papers can appear as nodes within a network, while relationships between them help researchers explore citations, similarity, shared references, authors, or other scholarly connections.
For beginners, this visual approach can make an unfamiliar research landscape easier to navigate. You can start with one relevant paper, explore nearby research, identify clusters of related work, find foundational studies, and investigate newer directions.
Research graphs are particularly useful for literature reviews, thesis preparation, topic exploration, and finding related research papers. However, they should complement—not replace—academic databases, careful reading, and critical evaluation.
This beginner’s guide explains what research paper graphs are, how they work, how to read them, the different types of graphs you may encounter, and how to use them effectively in your research workflow.
What Is a Research Paper Graph?
A research paper graph is a visual representation of relationships among academic publications.
Instead of displaying papers vertically as individual search results, a graph represents research as a network.
Individual papers are typically represented by nodes, while relationships between papers may be represented by edges or spatial proximity, depending on the tool and graph methodology.
Those relationships might indicate:
- One paper cites another
- Two papers share references
- Papers are similar
- Papers are frequently cited together
- Researchers collaborate
- Publications belong to related research areas
This gives researchers a visual way to explore the structure of academic literature.
Imagine searching for research on generative AI in higher education.
A traditional academic search engine might return hundreds of results.
A research graph might instead reveal recognizable groups of papers dealing with:
Generative AI in education
→ Academic integrity
→ AI-assisted assessment
→ Student perceptions
→ AI literacy
→ Automated feedback
→ AI-supported learning
You are no longer looking at isolated papers. You are beginning to see the structure of the research field.
Quick Answer: How Do Research Paper Graphs Work?
Research paper graphs organize academic publications into visual networks based on relationships such as citations, shared references, similarity, co-citation, or authorship.
Researchers normally begin with a relevant seed paper and explore connected publications around it.
The graph can help reveal:
- Related studies
- Foundational papers
- Research clusters
- Influential publications
- Newer studies
- Different research directions
The exact meaning of a connection depends on the platform. A line between two nodes should therefore never automatically be interpreted as meaning one paper directly cites the other.
Why Are Research Paper Graphs Useful?
Search engines are excellent for finding documents. Research graphs are particularly useful for understanding relationships between documents.
That distinction becomes important when you are exploring an unfamiliar field.
See Relationships Between Papers
Suppose you find five relevant studies.
Reading them individually tells you what each study investigated.
A research graph can help you investigate whether those papers belong to the same research cluster or connect to different branches of the literature.
This changes the question from:
“Which papers match my search?”
to:
“How does this literature fit together?”
Discover Important Research Faster
Beginners often struggle to determine which papers deserve attention first.
A literature network can provide clues about publications that appear important within a research landscape.
You may discover an older paper repeatedly associated with newer studies or a group of publications forming a particularly strong research cluster.
These signals can help prioritize your reading.
However, prominence within a graph should never be treated as proof of research quality.
Understand a Research Field Visually
Imagine entering a research area containing 500 relevant papers.
Reading every publication before understanding the field would be extremely inefficient.
A graph can provide an initial map.
You might discover that those 500 papers broadly form several research areas. Once those areas become visible, you can investigate representative papers within each cluster.
Find Papers Beyond Keyword Search
Academic terminology changes.
Two papers can investigate similar ideas without using identical keywords.
Graph-based discovery can therefore help researchers find literature that may not immediately appear from their original search phrase.
What Does a Research Paper Graph Look Like?
Although platforms visualize literature differently, several concepts appear frequently.
Understanding them makes research graphs much easier to interpret.
Nodes
A node typically represents an object in the network.
In a paper graph, that object is usually an academic publication.
A graph might contain:
                 Paper B
                    ●
                   / \
                  /   \
        Paper C  ●     ●  Paper D
                  \   /
                   \ /
                    ●
                Seed Paper
                   / \
                  /   \
          Paper E ●   ● Paper F
The real visualization can contain dozens or hundreds of nodes.
Connections or Edges
A connection between nodes represents some defined relationship.
Depending on the graph, this could represent:
- Direct citation
- Shared references
- Co-citation
- Similarity
- Collaboration
This distinction matters enormously.
Never assume:
Connection = direct citation
unless the tool explicitly defines it that way.
Research Clusters
Closely related papers can form recognizable groups.
These are often described as clusters.
For example, a graph about artificial intelligence in healthcare could reveal clusters around:
- Medical imaging
- Clinical decision support
- Electronic health records
- Drug discovery
- Patient monitoring
- Healthcare AI ethics
Clusters can help a beginner understand the major branches of a research field.
Node Size, Position, and Other Visual Signals
Graph platforms may encode additional information visually.
A platform might use:
- Node size
- Position
- Distance
- Publication year
- Citation count
- Connection strength
But these visual properties do not have universal meanings.
Always check the documentation or legend for the research tool you are using.
Types of Research Paper Graphs
Not every academic graph measures the same relationship.
Understanding the major types prevents one of the biggest beginner mistakes: interpreting every literature network in exactly the same way.
Citation Graphs
A citation graph represents citation relationships between publications.
For example:
Paper A → Paper Bcould mean Paper A cites Paper B.
Citation graphs are particularly useful for following how research develops across publications.
Similarity Graphs
A similarity graph groups publications according to measures of research similarity.
Depending on the platform, similarity may be calculated from combinations of scholarly metadata, citation relationships, references, keywords, or other signals.
Similarity graphs are particularly useful when your goal is:
“Show me more research like this paper.”
Co-Citation Networks
Two papers are co-cited when another publication cites both of them.
Suppose:
Paper C → Paper A
Paper C → Paper B
Paper A and Paper B have been co-cited by Paper C.
When papers are repeatedly cited together across the literature, that pattern can suggest an intellectual relationship between them.
Bibliographic Coupling
Bibliographic coupling looks in the other direction.
Two papers are bibliographically coupled when they cite some of the same references.
For example:
Paper A → Paper C
Paper B → Paper C
Paper A and Paper B share Paper C as a reference.
A high number of shared references can indicate that two publications draw upon similar intellectual foundations.
Author and Collaboration Networks
Not every research graph focuses exclusively on papers.
An academic network can also represent:
- Researchers
- Institutions
- Research groups
- Countries
- Collaborations
These networks can help identify major research communities within a discipline.
Research Paper Graph vs Traditional Academic Search
Research graphs and academic search engines solve different problems.
| Research Task | Traditional Search | Research Paper Graph |
|---|---|---|
| Search exact keywords | Excellent | Limited |
| Find a known paper | Excellent | Moderate |
| Discover related papers | Good | Excellent |
| Visualize relationships | Limited | Excellent |
| Identify research clusters | Difficult | Strong |
| Explore neighboring topics | Moderate | Strong |
| Search very recent literature | Strong when indexed | Depends on graph data |
| Understand field structure | Difficult | Strong |
You should therefore avoid thinking of graph-based discovery as a replacement for Google Scholar, PubMed, Semantic Scholar, or specialist academic databases.
A stronger workflow combines search + graph exploration + full-text reading.
How to Read a Research Paper Graph
At first, a network containing dozens of circles and connections can look complicated.
The following process makes it easier.
Step 1: Find Your Starting Paper
Begin with the paper you used to generate the network.
This is your seed paper.
Ask:
- Why is this paper relevant?
- What question does it investigate?
- What terminology does it use?
- When was it published?
Your seed provides context for interpreting the rest of the network.
Step 2: Examine Nearby Papers
Look at papers that the graph identifies as closely related.
Do not immediately download all of them.
Read their:
- Titles
- Authors
- Publication years
- Abstracts
Identify which ones genuinely match your research question.
Step 3: Identify Research Clusters
Zoom out and look for groups of papers.
Ask what each group appears to have in common.
For example:
                AI in Higher Education
                         │
        ┌────────────────┼────────────────┐
        │                │                │
 Academic Integrity   Assessment      AI Literacy
        │                │                │
   ● ● ● ●          ● ● ● ●          ● ● ●
These clusters can become your preliminary map of the field.
Step 4: Look for Foundational Studies
Investigate older influential papers that repeatedly appear around your topic.
They may explain:
- Foundational theories
- Original definitions
- Established methods
- Historical development
Do not assume the most highly cited paper is automatically the best source. Citation counts measure influence or attention, not methodological quality.
Step 5: Explore Recent Research
Next, examine newer papers.
Ask how they differ from foundational studies.
Have researchers:
- Introduced new methods?
- Tested different populations?
- Used better datasets?
- Challenged earlier findings?
- Applied the idea to a new context?
This helps you understand how the research area is evolving.
Step 6: Open and Verify Relevant Papers
A graph helps you discover research.
The original paper helps you evaluate it.
Once you identify a relevant publication, read the abstract and—where appropriate—the full paper before using it as evidence.
What Is a Seed Paper?
A seed paper is the starting publication used to explore a research network.
Choosing a good seed paper is important because your starting point can influence which part of the literature you initially encounter.
A good seed paper should be:
- Closely related to your question
- Academically credible
- Clearly focused
- Rich in relevant references
For broad field exploration, consider using multiple seed papers rather than relying on one.
For example, if your topic is:
Generative AI and university assessment
you might select separate seed papers focused on:
- Generative AI and assessment
- Academic integrity
- Student use of generative AI
Exploring several starting points reduces the risk of seeing the literature through only one narrow perspective.
How to Create a Research Paper Graph
The exact interface differs by research platform, but the conceptual workflow is straightforward.
Choose a Research Topic
Start with a clear topic.
Avoid something extremely broad such as:
Artificial intelligence
Instead try:
Generative AI feedback in higher education
Find a Strong Seed Paper
Use academic search to identify one or more relevant papers.
Read at least the abstract before selecting the paper as your starting point.
Generate the Literature Network
Use a research tool that supports literature visualization or similarity graphs.
The platform can then generate a network of papers related to your starting publication.
Explore Connected Papers
Don’t randomly click nodes.
Explore systematically:
Seed → nearby studies → clusters → foundational research → recent research
This gives your exploration a purpose.
Save Relevant Research
As soon as you find useful papers, organize them.
Useful categories might include:
- Foundational
- Theory
- Methodology
- Supporting evidence
- Contradictory evidence
- Recent research
- Potential gap
This prevents your research graph from becoming another source of information overload.
How Research Paper Graphs Help With Literature Reviews
Literature reviews are one of the strongest applications of research graphs.
A good literature review does not simply summarize papers. It explains how a body of research relates, develops, agrees, and disagrees.
Finding Foundational Literature
Graph exploration can lead you backward toward important earlier research.
These papers provide historical and theoretical context for your review.
Discovering Research Themes
Clusters can reveal recurring research themes.
Instead of writing:
Paper A says… Paper B says… Paper C says…
you can structure your literature review around themes:
Theme 1: Academic integrity
Theme 2: AI-supported assessment
Theme 3: Student perceptions
Theme 4: AI literacy
That produces a much stronger literature review structure.
Comparing Different Research Directions
Two clusters may investigate the same broad question differently.
One might use quantitative experiments while another uses qualitative interviews.
Recognizing these differences allows you to compare methodologies rather than merely summarize conclusions.
Identifying Potential Research Gaps
Once you understand what has been studied, you can begin asking what is missing.
Potential gaps might include:
- Understudied populations
- Geographic gaps
- Contradictory evidence
- Limited methodologies
- Missing longitudinal studies
- Poor connections between related subfields
A graph can help reveal patterns worth investigating, but a visible gap in a graph is not automatically a genuine research gap. It must be verified through broader literature searching and critical review.
Example: Exploring a Research Topic With a Literature Graph
Imagine a student wants to investigate:
How generative AI affects learning in higher education.
The student first finds a strong seed paper.
After generating a literature graph, four broad clusters emerge:
Cluster 1: Academic Integrity
These papers investigate plagiarism, AI-generated assignments, authorship, and assessment integrity.
Cluster 2: Student Learning
These studies examine whether generative AI supports understanding, feedback, problem-solving, and learning outcomes.
Cluster 3: Assessment Design
This cluster explores how universities can redesign assessments for environments where students have access to generative AI.
Cluster 4: AI Literacy
These publications investigate the skills students and educators need to use generative AI critically and responsibly.
The student has now learned something important.
Their original topic is not one research conversation.
It contains several interconnected conversations.
That insight can shape the research question itself.
Instead of:
“How does AI affect university students?”
the student might refine the question to:
“How does generative AI-assisted formative feedback influence undergraduate learning outcomes?”
This is where research graphs become more than attractive visualizations: they help researchers refine how they think about a topic.
How ResearchPal Helps You Explore Research Paper Graphs
Research discovery becomes more useful when the graph connects to the rest of the academic workflow.
ResearchPal brings literature exploration together with tools for searching, analyzing, organizing, citing, and synthesizing academic research.
Similarity Graphs
Similarity Graphs help researchers visually explore relationships around relevant academic papers.
Instead of treating each search result independently, researchers can investigate related literature and neighboring research areas.
Academic Search
Graphs are most useful when combined with search.
Once a graph reveals an interesting:
- Author
- Theory
- Method
- Keyword
- Research direction
you can return to Academic Search and investigate it more systematically.
Paper Insights
Once you’ve discovered a potentially relevant paper, you need to determine whether it is worth deeper reading.
Paper Insights can help surface information such as:
- Research objectives
- Methodology
- Findings
- Contributions
- Limitations
This supports faster initial screening.
PDF Chat
Researchers can examine full research papers more closely by asking questions about uploaded PDFs.
For example:
- What population did this paper study?
- What methodology was used?
- What were the main findings?
- What limitations did the authors report?
AI assistance can accelerate navigation, but important conclusions should always be checked against the original text.
Literature Review Generator
Once relevant studies have been identified, literature review tools can assist with organizing and synthesizing research across multiple sources.
The goal should not be to replace researcher judgment. Instead, AI can help reduce repetitive work while the researcher evaluates evidence, interprets disagreement, and builds the final argument.
Research Library
Saving papers into a structured research library means your discoveries do not disappear after you close the graph.
You can organize papers according to themes, projects, or research questions and return to them throughout the writing process.
Common Mistakes Beginners Make With Research Graphs
Research graphs are powerful, but interpreting them incorrectly can weaken your research.
Assuming Every Connected Paper Is Relevant
A graph connection does not automatically make a paper appropriate for your research question.
Screen the title, abstract, methodology, and full text where necessary.
Looking Only at Highly Cited Papers
Citation counts tend to favor older publications because they have had more time to accumulate citations.
New research can be highly important even with few citations.
Starting With a Weak Seed Paper
If your starting paper is only loosely connected to your question, your initial graph may lead you toward the wrong literature.
Use multiple high-quality starting points when possible.
Treating Connections as Proof of Quality
A highly connected paper can still have methodological weaknesses.
Graph position is not peer review.
Ignoring Traditional Academic Search
A research graph cannot guarantee comprehensive coverage.
Combine graph exploration with:
- Keyword searches
- Semantic searches
- Specialist databases
- Reference checking
- Citation searching
This is particularly important for systematic or comprehensive reviews.
Best Practices for Using Research Paper Graphs
A simple beginner workflow is:
Search → Select seed papers → Generate graphs → Identify clusters → Find foundational studies → Find recent studies → Screen papers → Read important sources → Organize evidence → Expand search → Write
A few principles make this process stronger:
- Use more than one seed paper.
- Learn what the graph’s edges actually represent.
- Don’t equate citations with quality.
- Compare older and recent literature.
- Save useful papers immediately.
- Take notes while exploring.
- Search outside the graph.
- Verify AI-generated summaries against original papers.
- Read key studies in full.
- Treat graphs as discovery aids rather than evidence themselves.
Research Paper Graphs vs Citation Lists
A reference list tells you which sources a paper cited.
A research graph can help you investigate a broader network of relationships.
Consider:
REFERENCE LIST

Paper A
Paper B
Paper C
Paper D
Paper E
versus:
RESEARCH NETWORK

       Paper A ─── Paper B
          │          │
          │       Paper C
          │          │
       Paper D ─── Paper E
The second representation adds relational context.
That can help answer questions such as:
- Which papers belong together?
- Which research areas overlap?
- Where did this idea originate?
- Which directions developed later?
Reference lists remain extremely valuable. Graphs simply provide another way to navigate the scholarly landscape.
Can Research Paper Graphs Help Find Research Gaps?
Yes—but with an important qualification.
Research graphs can help suggest potential gaps.
For example, you might observe a strong cluster around AI-assisted learning and another around students with disabilities, but very little research connecting the two.
That observation could suggest a question worth investigating.
However:
An empty space on a graph is not proof of an academic research gap.
The apparent gap might exist because:
- Relevant papers were not indexed.
- Your seed papers were too narrow.
- Researchers use different terminology.
- The graph algorithm emphasizes different relationships.
- Relevant research exists in another database.
A credible research gap should therefore be verified through broader academic searching and critical literature analysis.
Final Thoughts
Academic literature is not simply a collection of independent documents.
Every research paper exists within a wider scholarly landscape of previous findings, competing theories, methodological traditions, citations, authors, and emerging research directions.
Research paper graphs make parts of that landscape visible.
For a beginner, this can transform an intimidating collection of search results into a more understandable map.
Start with several strong seed papers. Explore their surrounding networks. Identify major clusters. Trace foundational research. Compare newer developments. Then open, read, evaluate, and organize the papers that genuinely matter.
Most importantly, remember what a research graph can—and cannot—tell you.
It can help you navigate research.
It cannot determine whether a study is credible, whether its methodology is appropriate, or whether its conclusions should be accepted.
The strongest research workflow therefore combines interactive literature graphs, academic search, critical reading, source verification, research organization, and thoughtful synthesis.
ResearchPal brings these stages closer together through Similarity Graphs, Academic Search, Paper Insights, PDF Chat, Literature Review generation, citation tools, and Research Library management—helping students and researchers move from seeing a network of papers to actually understanding the research behind it.

